Expected Moves is Scouter’s core analysis page. It helps you study upcoming catalysts (earnings, launches, regulatory events, and more) and see modeled Bull Target and Bear Floor ranges built from historical price volatility and context — not from options markets.
Open it two ways:
- Expected Moves — weekly grid of catalysts, then click into a ticker
- Any quote page (for example NVDA or AAPL) — same analysis for one symbol, with a shareable link
Start from the week grid
- Go to Expected Moves without searching a ticker.
- Scan the Mon–Fri grid for catalyst picks.
- Click a cell to open the full analysis for that name.
This is the fastest way to browse “what’s happening this week” without knowing a ticker in advance.
Read a single ticker
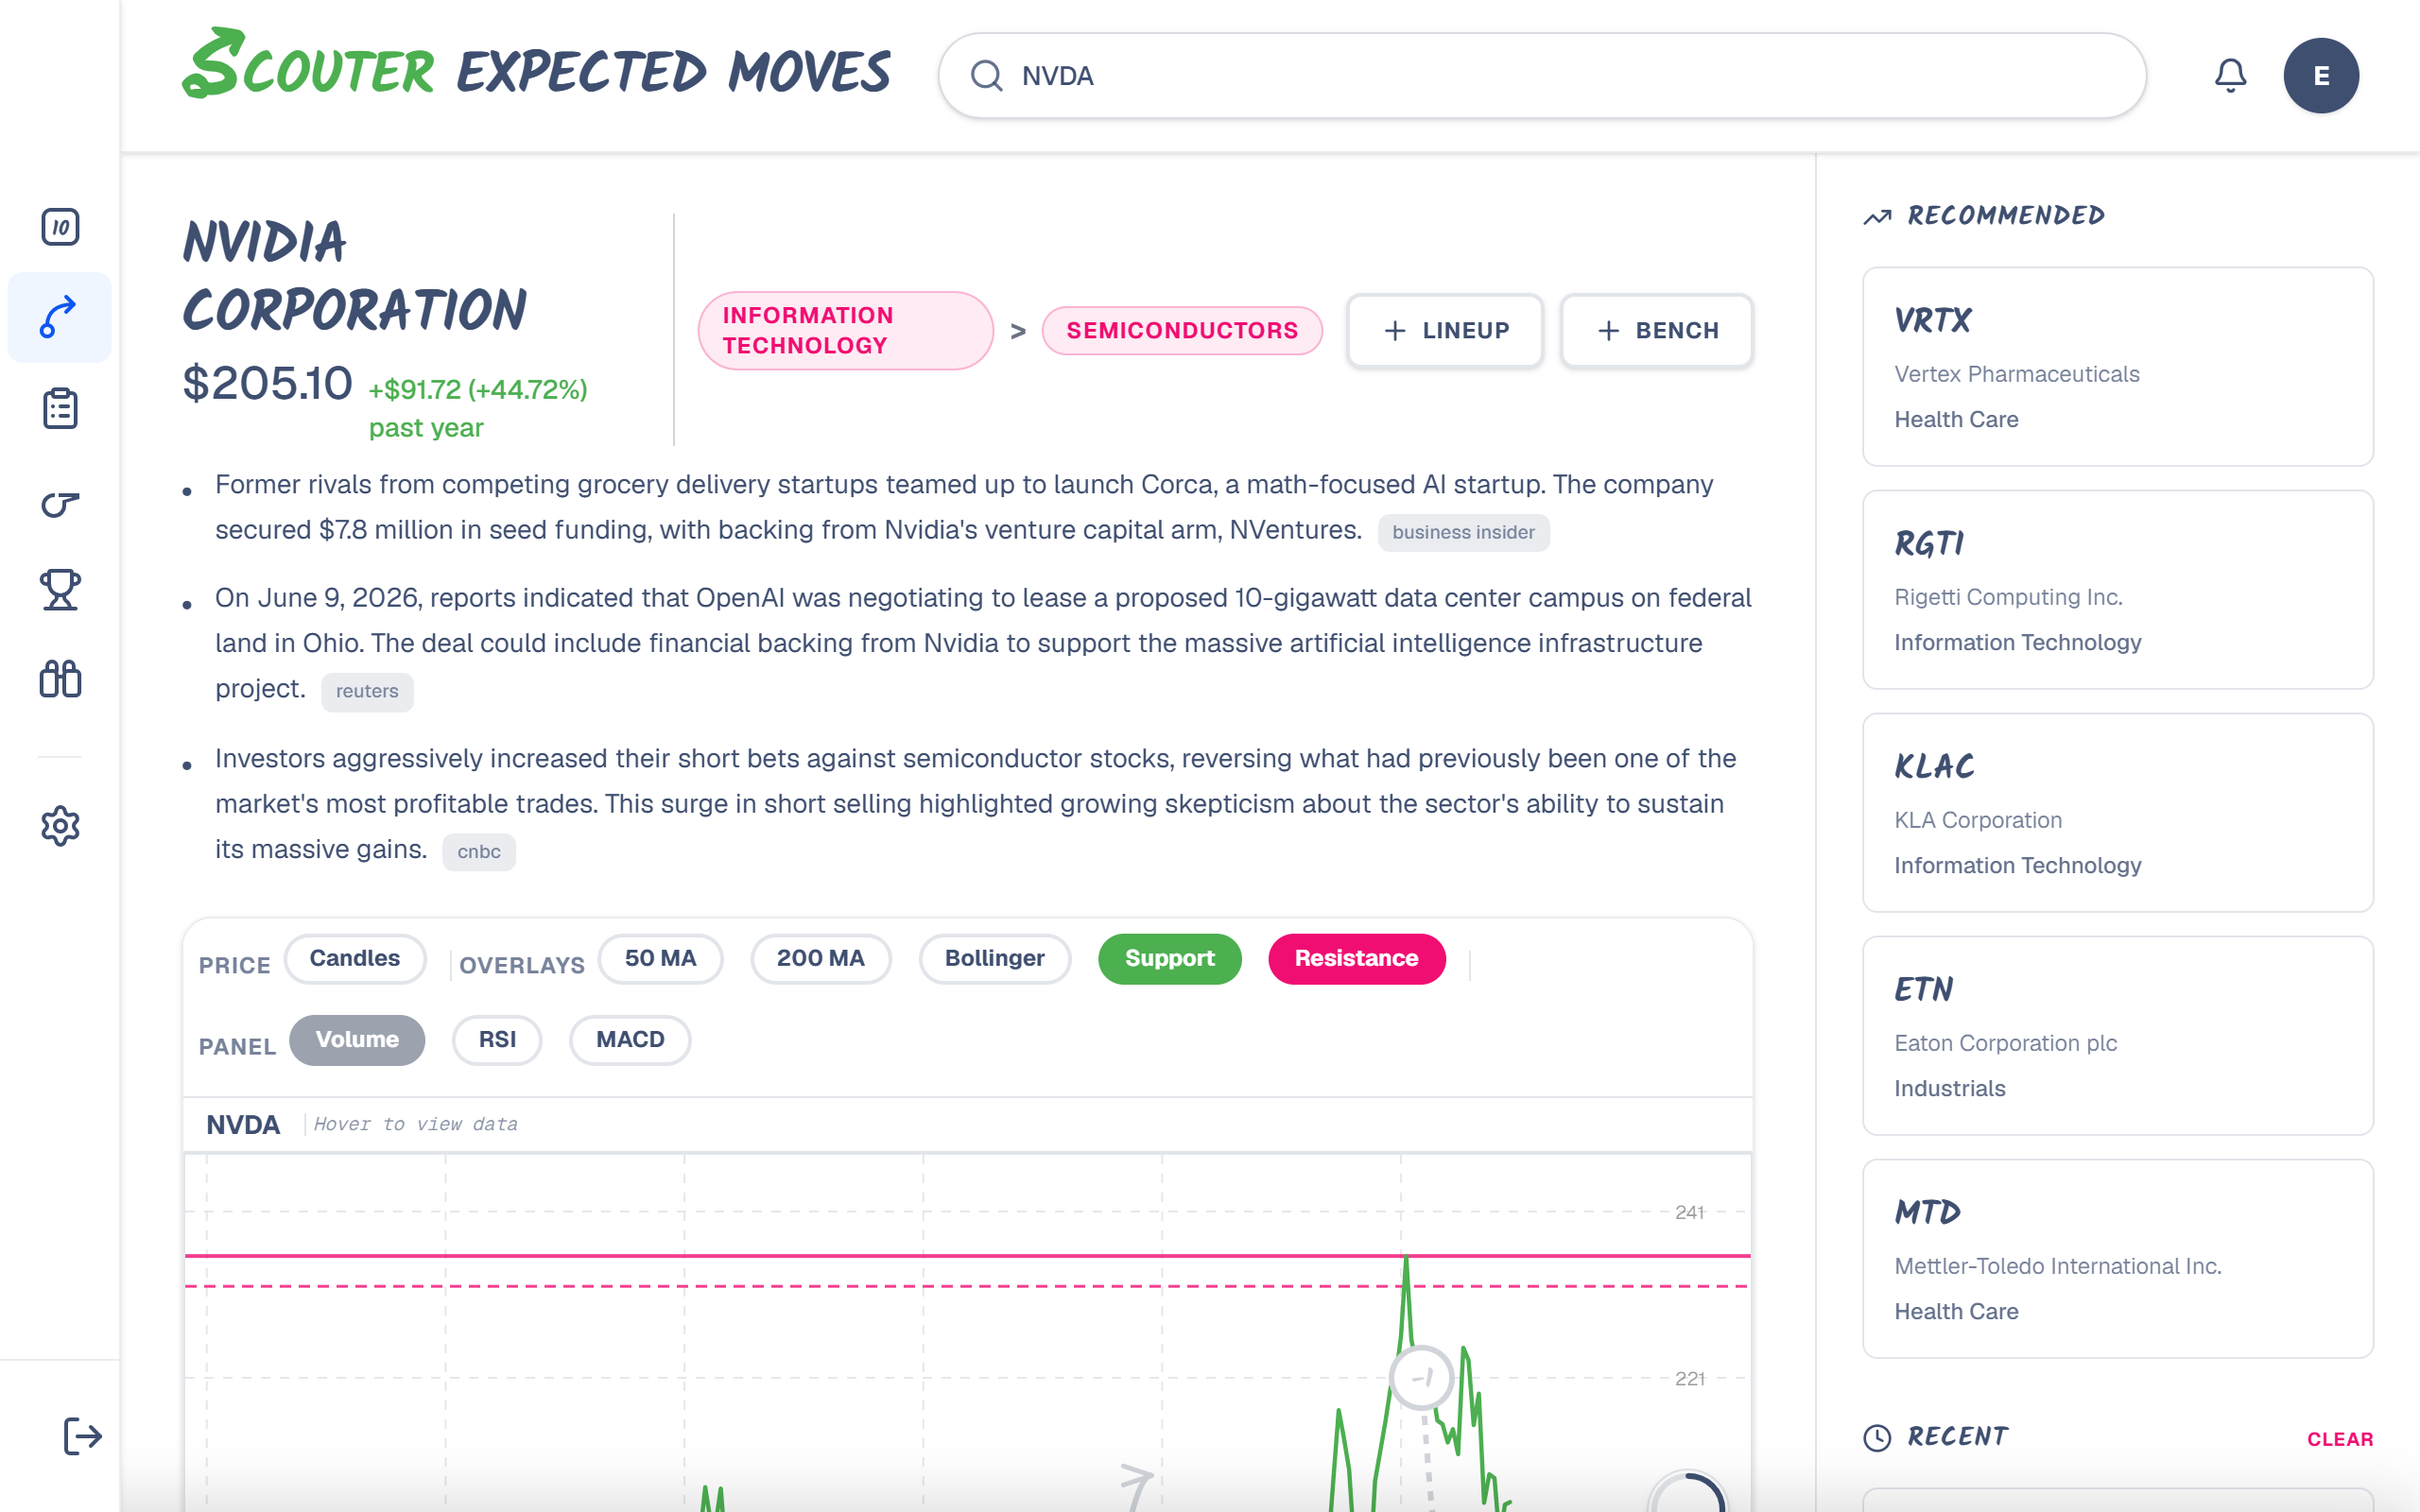
Search from the header or open a quote URL. The page typically includes:
Header
Company name, last price, roughly one-year change, sector/industry tags, and toggles to add the ticker to your Bench or Starting Lineup (Lineup requires Starter or Premium). Free accounts also see a credits badge showing how many Expected Moves unlocks you have left this period.
Chart
Price history with catalyst markers and bull/bear projection arrows when unlocked. Use the flat range controls (1M, 3M, 6M, 1Y, 5Y, ALL) to change the lookback; shorter ranges show a matching forward Expected Moves window (1Y is the default: ~12 months of history plus ~12 months ahead). 5Y and ALL still use a 12-month forward horizon. Open Indicators for moving averages, Bollinger bands, support/resistance, volume, RSI, and MACD.
News
Short AI-written summaries of recent headlines, usually with source tags so you can see where a story came from.
The Schedule
A list of dated event cards. For upcoming events you will often see:
- Bull and bear probabilities
- Bull Target and Bear Floor
- A short description and rationale
Past events may show what actually happened after the date.
The Stats
Fundamentals and related metrics (valuation, growth, margins, and more). For ETFs you may see holdings and sector/geography exposure. Click individual stat cards when you want peers, holders, or earnings-surprise detail.
Access: preview, Free credits, or trial/paid unlimited
| Situation | What you get |
|---|---|
| Logged out | Preview — past events and limited detail |
| Free, with credits | Full analysis when a credit is spent on a new ticker this period |
| Free, out of credits | Lite schedule; targets hidden |
| Starter or Premium (including free trial) | Unlimited full analysis |
New customers start a 30-day free trial of Starter or Premium (card required). On Free, credits are charged when the full page finishes loading for a ticker you have not unlocked this period. Reopening the same ticker later in the period is free. Details: Plans and what’s included.
How the ranges are built (plain language)
Bull and bear levels are research scenarios. Scouter combines:
- Historical realized price volatility from market prices
- Time until the catalyst
- AI-assisted context around the event
Scouter does not use options implied volatility, options flow, or “what the options market is pricing” for Expected Moves. Treat targets as diligence aids, not guarantees or trade instructions.
When the page looks incomplete
| Situation | Typical view |
|---|---|
| Logged out | Preview only |
| Free, no credits left | Lite schedule |
| ETF | More holdings/exposure; fewer classic earnings catalysts |
| Crypto / commodity | Price/volatility focus |
| Delisted name | Historical “what happened” when available |
Related: Expected Moves week grid · Starting Lineup & Bench · Common questions · What markets and symbols are covered?