Trend Scores ranks sectors and themes so you can see where sentiment and catalyst support look stronger or weaker. Open Trend Scores from the sidebar.
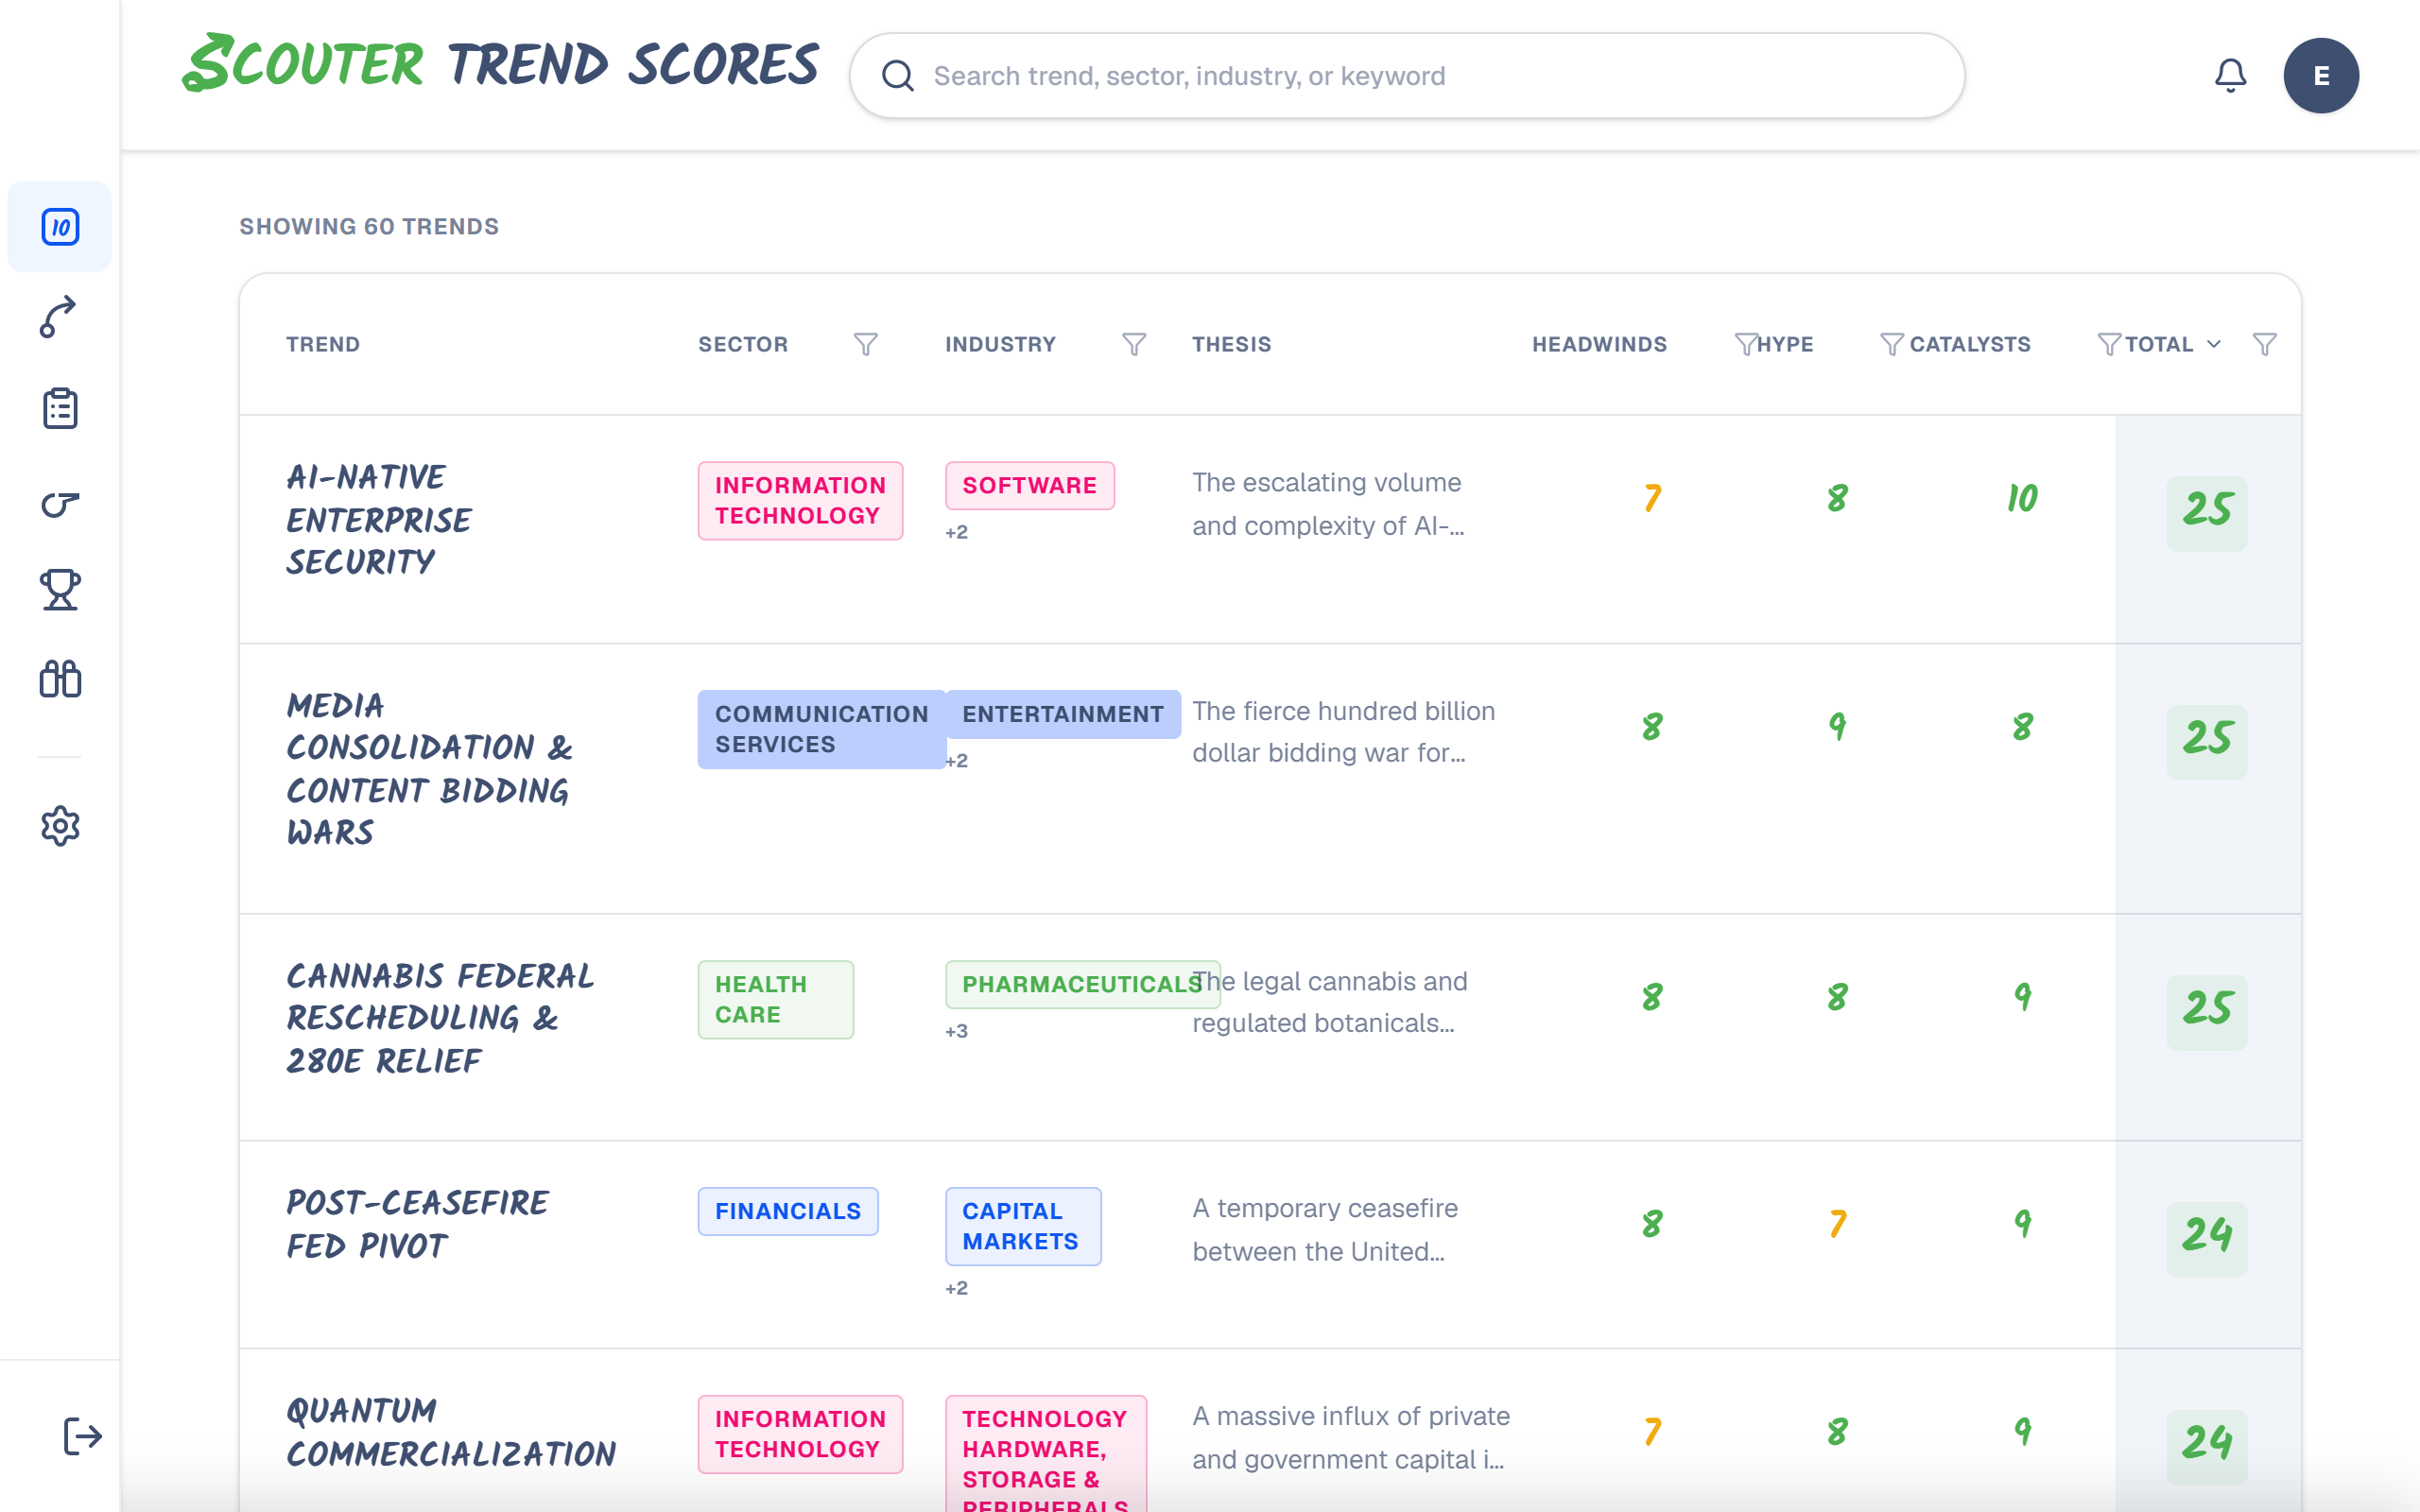
What the table shows
Each row is a trend or theme. Columns typically include:
- Trend — name of the theme
- Sector / Industry — classification
- Thesis — short written summary
- Clearance, Hype, Catalysts — component scores from 0–10
- Total — sum of the three components (0–30)
Higher totals mean the theme currently scores stronger on those factors. Scores are research context — they are not buy/sell recommendations.
How to filter and search
Use the column filters to narrow by score bands (for example Strong / Mid / Weak) and other attributes. Use search to find text in the thesis, name, sector, or industry. Combine filters when you want a short list of themes to investigate further.
Opening a row (what you see by plan)
| Plan | What happens when you click a row |
|---|---|
| Logged out | Clearance / Hype / Catalysts columns may be hidden until you sign up. Total and Thesis stay visible. |
| Free | You see all score columns. The detail view is a teaser: thesis and Pure-Plays are visible; deeper breakdowns and the basket chart stay blurred until you upgrade. |
| Starter or Premium | Full detail modal: component breakdowns, equal-weight trend basket chart, Pure-Plays, and links toward related Top Ideas when available. |
Pure-Plays are example tickers tied to the theme — useful jumping-off points into Expected Moves or Shortlist.
Suggested workflow
- Sort or filter for themes with strong Totals (or the component you care about most).
- Read the thesis so you understand why the theme is scored that way.
- Open the detail modal (Starter+) and note Pure-Plays.
- Research those tickers on Expected Moves or screen related names on Shortlist.
“I can’t see the full breakdown”
The complete unblurred modal needs Starter or Premium (including during a free trial). Free accounts still get the teaser. Compare plans on Pricing.
Related: Top Ideas · Plans and what’s included